


The Mobility Indicator 2023: Revealing discrepancies between people's transportation desires and actions
We are closing in on a perfect alignment between people's preferences for car usage and their actual practices. The situation for bikes and public transit differs significantly, according to the Mobility Barometer 2023. “I find it interesting to see how people’s habits change. The one constant is the need for mobility,” said Pehr Oscarson, President and CEO of MEKO.

In May, MEKO released the second edition of the Mobility Barometer. More than 4,000 people across Sweden, Norway, Denmark, and Finland responded to questions about their transportation habits, making it the most comprehensive survey of its kind in the Nordics.
The report shows that a tougher economy affects how we transport ourselves. The car is still number one, but we think more about costs than before. It’s also clear that the EV boom is slowing down. It's not just that they're considered expensive to purchase, higher electricity prices also make people less eager, said Pehr Oscarson.
One of the report's most talked-about sections, namely the Mobility Indicator, strives to identify discrepancies between respondents' preferred and actual transportation modes.
1. Spotlight on the Car
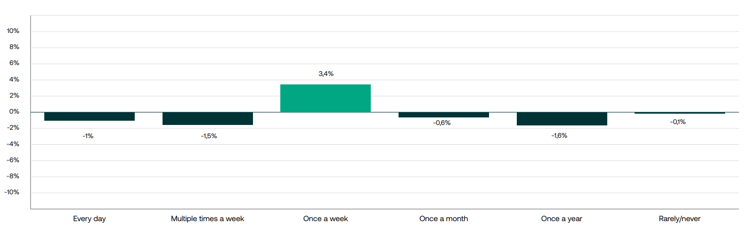
Car usage aligns remarkably well with our expectations, a factor that could explain its widespread use and popular perception as the most convenient mode of transportation. When users prioritise comfort or speed, they often choose cars that best fit these specific needs.
Car usage is nearing a perfect match. On average, respondents exhibit a slight preference to use their cars more over the weekend, with a 3.4 percentage point difference between those who wish to use it and those who actually do. City dwellers would prefer to use cars a fraction more weekly than their current usage, contrasting with rural regions. The most significant obstacle to car usage is not due to the car itself, but the lack of access to one.
Compared to last year, discrepancies have decreased from 13 percentage points to 10.1 this year.
2. Spotlight on the Bike
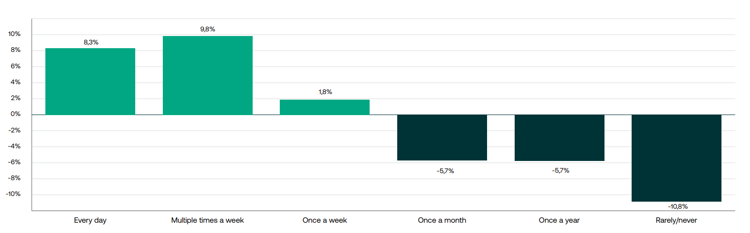
The bicycle, widely seen as the ideal choice for health-conscious and environmentally aware Northerners, isn't as appealing as perhaps expected, due to its lack of speed and comfort, despite being a feasible option in congested areas.
So, what explains the disconnect between people's desires and actual practices? Although people wish to bike more than they currently do, bicycles just fall short in meeting overall transportation needs. Even though people want bicycles to play a more prominent role in their lives, their current usability is somewhat limited.
3. Spotlight on Public Transit
Public transit positions itself somewhere in between cars and bicycles. So, where does that leave public transit? In the green mobility revolution, public transit's offering and role must evolve to maintain its relevancy and remain an integral part of our daily commute. As vehicles grow greener, simply being an environmentally friendly option will not suffice.
People wish they could utilise public transit slightly more on a weekly basis, although not as much as bicycles. The primary difference is not daily usage per se, but that more people wish to use public transit a few times a week, compared to current usage.
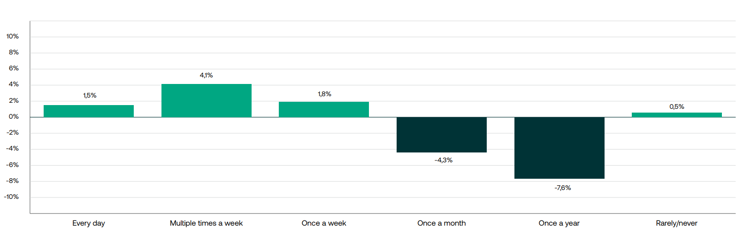
Light green bars above 0% correspond to how many more people on average that would like to use that particular mean of transportation compared how many actually use it. Dark green bars below 0% indicates the share of people that use it more than they would like to.

